A bullish candlestick means that the price has closed higher than it opened, in a given time period. Bullish candlesticks are not all the same: they all tell a different story.
Every candlestick that forms on your chart is like a tug-of-war story between buyers and sellers. A bullish candlestick is the exact opposite of a bearish candlestick.
Bullish Candlestick Definition
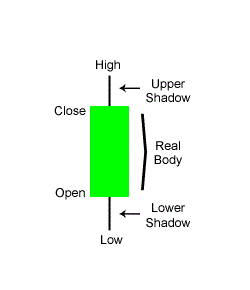
A bullish candlestick by definition is a candlestick that closes higher than its opening prices in a time period, for example, 1 day. Bullish candlesticks are typically represented as green or white candlesticks. Most traders prefer to use green.
Below is an example of a bullish candlestick. You can see that the close price is higher than the open price.

All candlesticks have these 4 things:
- an opening price
- a closing price
- a high price
- a low price
These things tell a lot about candlestick.
5 Levels of Bullishness
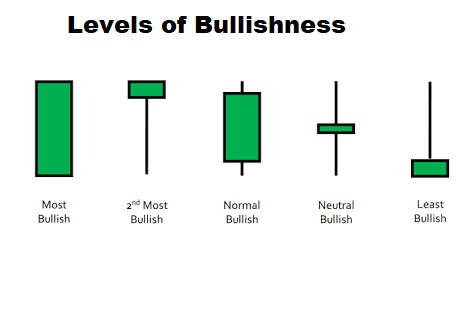
The following are the common levels of bullishness you can find in a bullish candlestick:
- Most bullish
- 2nd most bullish
- Normal bullish
- Neutral bullish
- Least bullish
These levels of bullishness are dependent of:
- Closing and opening prices
- Length of the body of the candlestick
- The size of the body
- The length of the upper and the lower shadow
Now, let’s look at each of these 5 bullish candlesticks in detail and understand how and why they form the way they do…
Most Bullish Candlestick
This is a candlestick that has very little to none at all high or low. With this candlestick, as soon as the price opened, it simply went up and where it closed is also it’s high.
High price = close price.
This means that buyers were in complete control that whole time.
2nd Most Bullish Candlestick
This candlestick opened during its course in the period, sellers took control and drove it all the way down, but then buyers came in and drove the price all the way up to the close, which also happens to be its high.
So here the close price equals the high price.
These types of candlesticks have what is called a very long, lower shadow or wick.
Normal Bullish Candlestick
This candlestick will have upper and lower shadows of roughly the same lengths, not greater than the length of the body, and it also has a reasonably long body.
The sellers tried to push the price down after opening resulting in the lower shadow or wick, but buyers came in and pushed the price up.
Buyers kept pushing prices up to make a high but then sellers came in and pushed it down to a close below the high resulting in the upper shadow or upper wick.
Neutral Bullish Candlestick
If you see a bullish candlestick that has a very tiny body and even lengths of the upper and lower shadow or wicks, then this is most likely a neutral bullish candlestick.
Buyers and sellers are almost equally matched here but the fact that it closes slightly above the opening price indicates buyers have won in this period but may be losing strength.
5: Least Bullish Candlestick
This candlestick is represented by a very long upper shadow or wick and a small body with little to no lower shadow or wick at all.
This very long upper shadow or wick means only one thing:
Buyers pushed the price up from the opening price but sellers came with such force and pushed the price down, and made it close just above the opening price.
The fact that the closing price is a little bit above the opening price makes the candlestick bullish, but the very long upper wick gives an extremely bearish sentiment to this candlestick. Which means the buyers may be losing steam here.
