In this post, I will cover the definition of a bearish candlestick. As well as tips on determining the different types of levels of bearishness in a candlestick, depending on their length, opening and closing prices.
The official definition of a bearish candlestick: a bearish candlestick is a candlestick that has a lower closing price than the opening price in a given period or timeframe.
A bearish candlestick is technically the exact opposite of a bullish candlestick. It is generally shown on the charts are either red or a black candlestick. I prefer it to be red.
There is more to a candlestick than just the opening or closing prices and the highs and the lows.
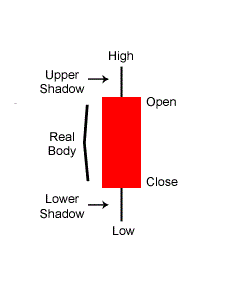
4 Main Parts Of A Candlestick
The 4 most important parts of a candlestick are these:
- Open: this is the opening price
- Close: this is the closing price
- High: this is the highest price in a given period
- Low: this is the lowest price in a given period.
From these 4 things above you have these:
- Candlestick body: the spot between the open and the close price is the body of a candlestick.
- Upper shadow (sometimes called upper wick): the spot between the open and the high price.
- Lower shadow (sometimes called lower wick): the spot between the close and the low of the candlestick.
All these things listed above determine the level of bearishness in each bearish candlestick.
Bearish Candlestick Definition
This is the definition of a bearish candlestick: a bearish candlestick is a candlestick that has a lower closing price than the opening price in a given period or timeframe.
In other words, the price opened at a high price and ended lower.
On this bearish candlestick below, notice that:
- The closing price is lower than the opening price.
- Price moved up and made a high during the period but wasn’t sustained as it fell back down.
- Price also made a low.
When you see a bearish candlestick on your chart, this means that there were a lot more sellers than buyers driving the price down.
Different Levels Of Bearishness In A Bearish Candlestick
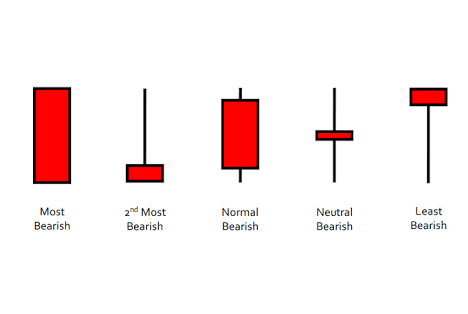
Look at these 5 candlesticks below, they show the different levels of bearishness in a bearish candlestick.
Now, let us go through each of these 5 candlesticks and understand what each means…
Most Bearish Candlestick
This is represented by a candlestick that has hardly any upper and lower shadow. This means that once the candlestick opened, sellers pushed the price all the way down to it close. This means the opening price=the high and the closing price=low.
The sellers were in complete control during this time.
2nd Most Bearish Candlestick
This is represented by a very long upper shadow or wick and a very little body.
The fact that it has a very long upper shadow indicates that at one stage, the buyers took control and drove the prices all the way up, but then sellers came in force and drove the price all the way down, not really making a low because the closing price is also the low price.
The fact that the closing price is closer to the opening price means the body of this candlestick is generally very small.
Normal Bearish Candlestick
In a candlestick like this, you have an upper and lower shadow almost of the same length and generally a long body of the candlestick between them.
Neutral Bearish Candlestick
The fact that this candlestick closed a little lower than the opening price ensures that it has a very thin body which indicates that sellers did have control over the closing price but not much.
The upper and the lower shadows generally have the same lengths.
Least Bearish Candlestick
The fact that this candlestick had a very long lower shadow and a small body on the top indicates that sellers took control at one stage and drove prices all the way down, making a low but this was not sustained.
And then the buyers took over and drove prices up all the way from the low. The greater the length of the lower shadow, the greater the strength of the buyers.
The fact that this candlestick closed lower than the opening price indicates bearishness but the sellers may be losing control.

