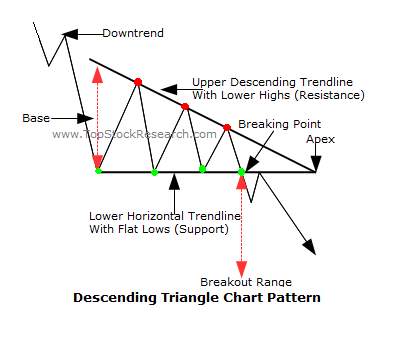
The descending triangle chart pattern forex trading strategy, as the name says is based on the descending trial pattern and it is the complete opposite of the ascending triangle chart pattern forex trading strategy.
The descending triangle pattern is a bearish chart pattern, when means if you see it, there’s the likelihood that price will fall.
So how do you spot the descending chart pattern on the chart? Well, watch for these:
- The market can be in an uptrend or the can already be in a downtrend
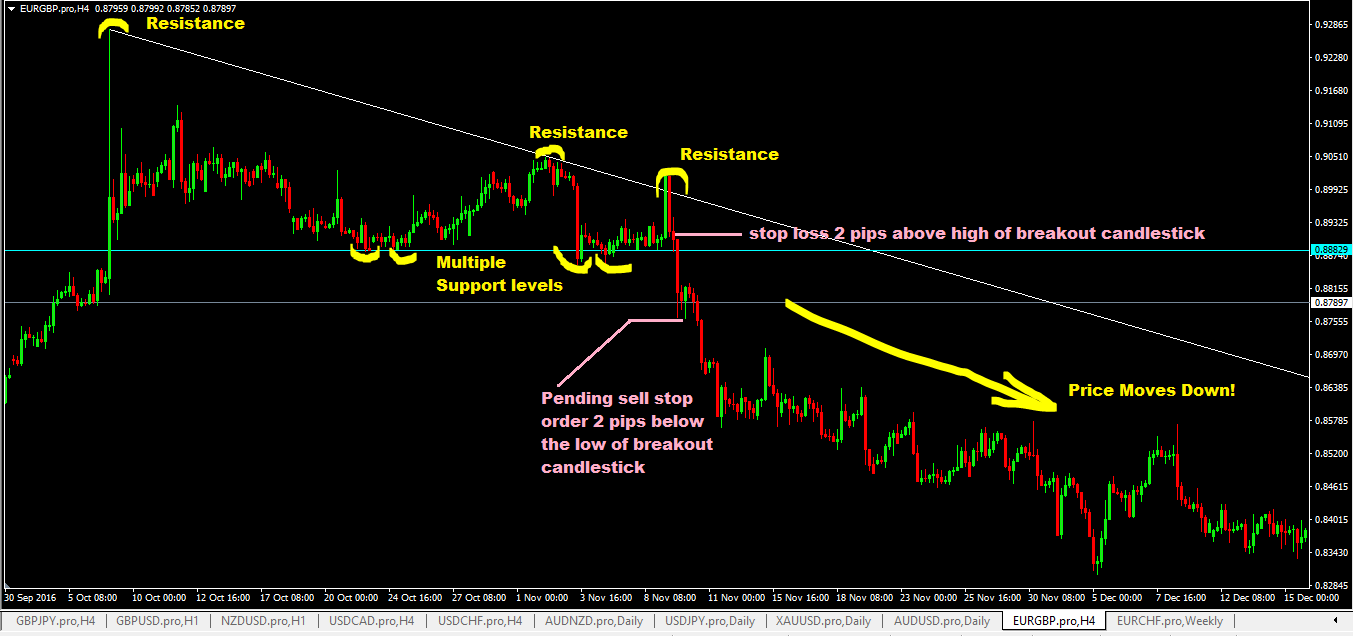
- then you will see price will start to consolidate as it hits a support level and it will bounce up, and hits resistance and move down to the support level and move up and each time it moves up, the resistance will continue to squeeze price down until a breakout happens to the downside.
Here’s what I’m talking about:

How To Trade The Descending Triangle Chart Pattern-The Trading Rules
- Wait for the breakout candlestick to form…the breakout candlestick is the candlestick that makes a sustained move down breaking the support level and must close below it.
- place a pending sell stop order 2 pips below its low.
- place your stop loss 5-10 pips above the breakout candlestick’s high.
- for take profit target, you can use previous swing lows or calculate based on 1:3 risk to reward ratio.

Advantages of the Descending Triangle Chart Pattern Forex trading strategy
- explosive downward price moves downwards tend to happen when this pattern forms so it really pays to know this chart pattern.
- risk:reward are good for this forex trading system.
Disadvantages of The Descending Triangle Chart Pattern Forex Trading Strategy
- Sometimes the breakout candlestick can be very long which means your stop loss distance in pips can be huge
- Other times instead of breaking downwards, the price shoots up. In such instances, you can switch to using the trendline breakout forex trading strategy.
Further Reference For You To Read About The Descending Triangle Chart Pattern
Don’t forget to share this forex trading system with your friends.