The inverse head and shoulders chart pattern forex trading strategy is the complete opposite of the head and shoulders chart pattern forex trading strategy.
It is a 100% price action trading strategy and the use of other indicators to go with this system is not recommended.
- Currency Pairs To Trade: Any
- Timeframes: Any, but I suggest you use 15-minute timeframe and upwards.
What Is The Inverse Head And Shoulders Pattern?
The inverse head and shoulders chart pattern is a bullish reversal pattern.
When the inverse head and shoulders pattern forms in a downtrend market, it indicates a potential trend change to a bullish trend.
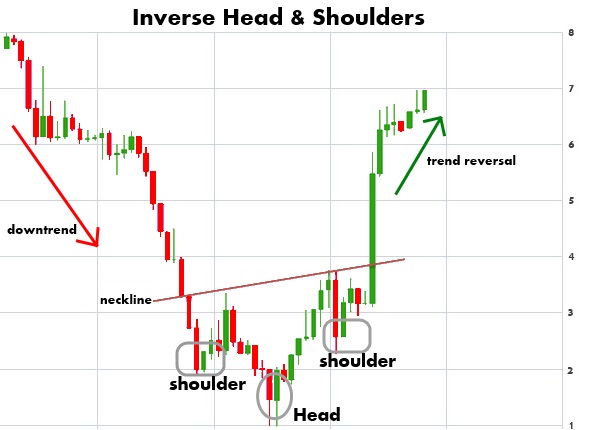
This chart below is an example of an inverse head and shoulders bullish reversal pattern:
- Note that the previous trend was a downtrend.
- After the inverse head and shoulders pattern formed, the trend was upward.
- The main features of an inverse head and shoulders pattern are the 2 shoulders, the head, and the neckline.
- The breakout of the neckline trendline completes the inverse head and shoulder pattern.
How To Trade The Inverse Head And Shoulders Chart Pattern
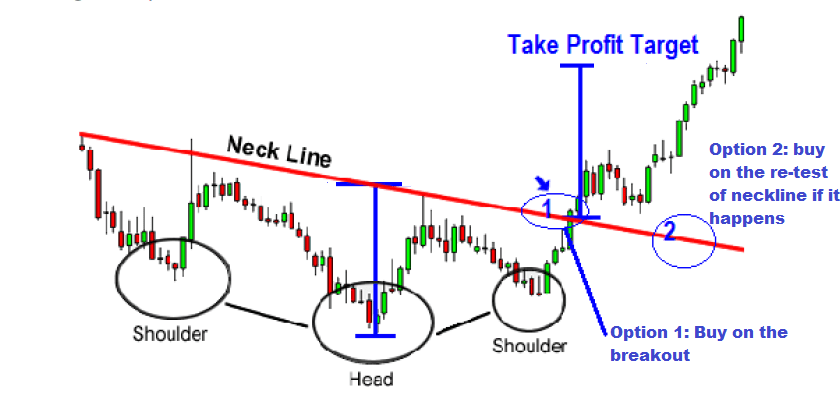
There are two ways of trading the inverse head and shoulders pattern:
- Trade the breakout of the neckline or
- Trade the re-test of the neckline, if the price heads down to it and touches that neckline.
How To Trade The Breakout Of The Neckline:
- Make sure the breakout candlestick closes above the neckline.
- When that happens, place a pending buy stop order at least 1-2 pips above the high of that breakout candlestick.
- Place your stop loss 5-10 pips or can be more, below the low of the breakout candlestick.
- For take profit target, you can calculate it based on risk:reward of 1:3 or if not, calculate the distance in pips between the head and the neckline and use that as your take profit target. For example, if the distance in pips between the head and the neckline is 150 pips then your profit target should be 150 pips.
How To Trade The Retest Of The Neckline
In this case, a breakout of the neckline has already happened and the price has moved up but eventually, it comes down and touches the neckline. There is a potential that price will find support on that neckline and will head back up so therefore you should be ready to buy. The key to buying here is to watch for bullish reversal candlesticks.
- When the price comes down and touches the neckline watch for a bullish reversal candlestick to form.
- Then place a buy stop pending order 1-2 pips above the high of that candlestick
- Place your stop loss 5-10 pips below the low of that bullish reversal candlestick
- For take profit aim for a risk:reward of 1:3 or calculate the distance in pips between the head and the neckline and use that as your take profit target (see chart above)
Advantages of The Inverse Head And Shoulders Trading Strategy
- Risk:reward for this trading system is really good if the trade works out as anticipated.
- Big pips move in hundreds to thousands of pips do happen out of this reversal chart pattern and you can catch some of those if you trail stop and ride out the trend without placing a profit target.
- Potential to pyramid your way to additional profits when price re-tests the neckline…that is make another (2nd) buy trade whilst the first trade (on the breakout of the neckline) is still alive.
Disadvantages of The Inverse Head And Shoulders Trading Strategy
- New forex traders may have difficulty identifying the inverse head and shoulders chart pattern on their charts.
- Sometimes, the breakout candlestick is too long which will result in your stop-loss distance being too large

