I bet you are here because you are after james16 forex price action trading strategies.
Well, the good news is I have 6 of James16’s forex price action trading strategies which I have researched and compiled in an easy to read manner so you can read and understand what the price action patterns he uses and what the trading rules.
Disclaimer: what I’m presenting here is my interpretation of james16 price action trading strategies. I may not be 100% right. But I think I will be pretty close to being right for those that I don’t really get right.
Makes sense?
Who Is James16?
James16 was a forex trader who started a thread over at forexfactory.com about price action trading and had a fairly large following when it began.
From what I know, he is no longer active on that thread anymore.
Where is he from?
Don’t know. Don’t care.
Trading Timeframes
James16 is a fan of trading the daily and the weekly timeframes.
Why?
Because he says that larger timeframes eliminates muce of the noise found in smaller timeframe (so you can see the bigger picture) and give more chance for your trades becoming successful.
Currency Pairs
James16 price action trading strategies are not limited to be traded on just a few specific currency pairs. You can trade the james16 forex price action trading strategies on any currency pairs you want.
Forex Indicators
James16 has been documented to use these simple moving averages: 21, 79 and 365. EMA 89.
The main purpose of using these moving averages was for him to identify dynamic support and resistance levels.
James16 Trade Entries
So how does James16 trade? What does he focus on? Well, here’s what I’ve found:
- in a downtrend market, Jame16 focuses on looking for opportunities to sell in a rally.
- in an uptrend market, he looks to buy on the dips.
In order to do that, he focuses on:
- price action on support and resistance levels
- also price action on Fibonacci levels
Jame16 trade entries are based on 2 to 4 bars reversal patterns clustered near what he calls are “levels/areas/points of confluence”.
So here are the 6 price action chart patterns that James16 uses and has built trading strategies around them.
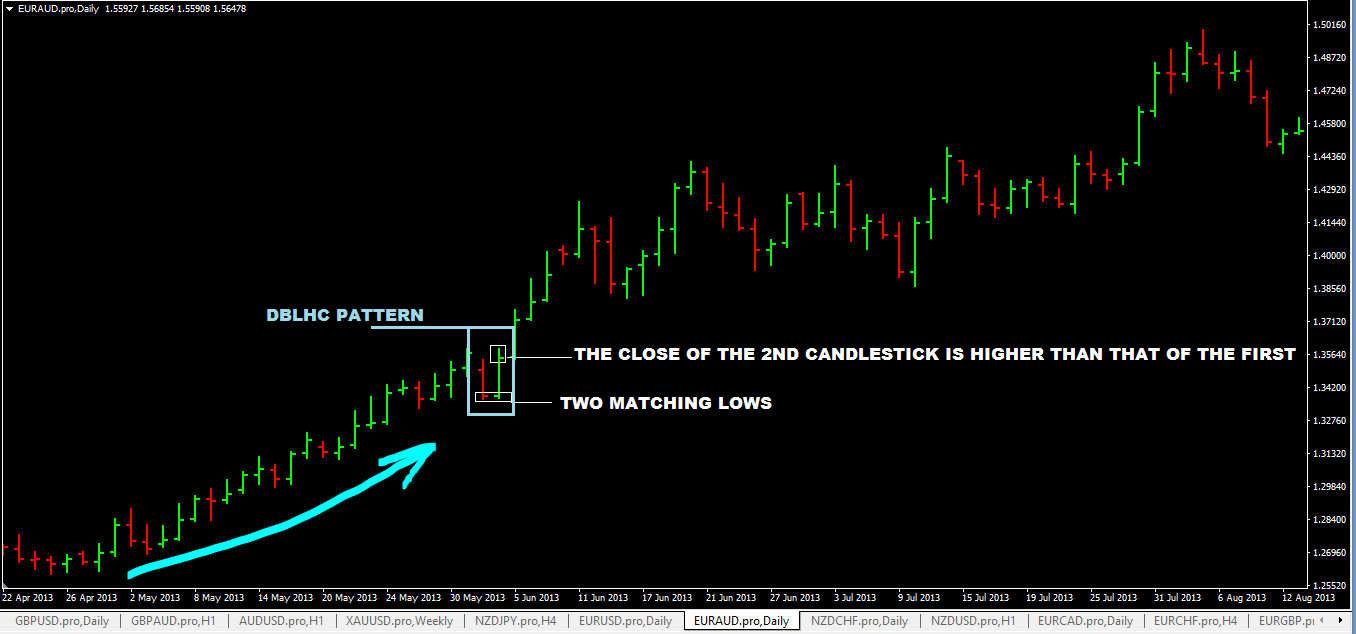
#1:Double Bar Low Higher Close (DBLHC) Strategy
The DBLHC is a 2 bar pattern.
The first and the second bar should have matching lows or lows that are within two pips of each other.
In other words, their lows are almost on the same price level.
Now the 2nd bar is the most important bar. This bar must close higher than the high of the first bar.
Once these conditions are satisfied, you have a DBLHC price pattern.
The DBLHC is a bullish pattern. When you see this pattern, you should be looking to buy.
Here’s what a DBLHC pattern looks like:
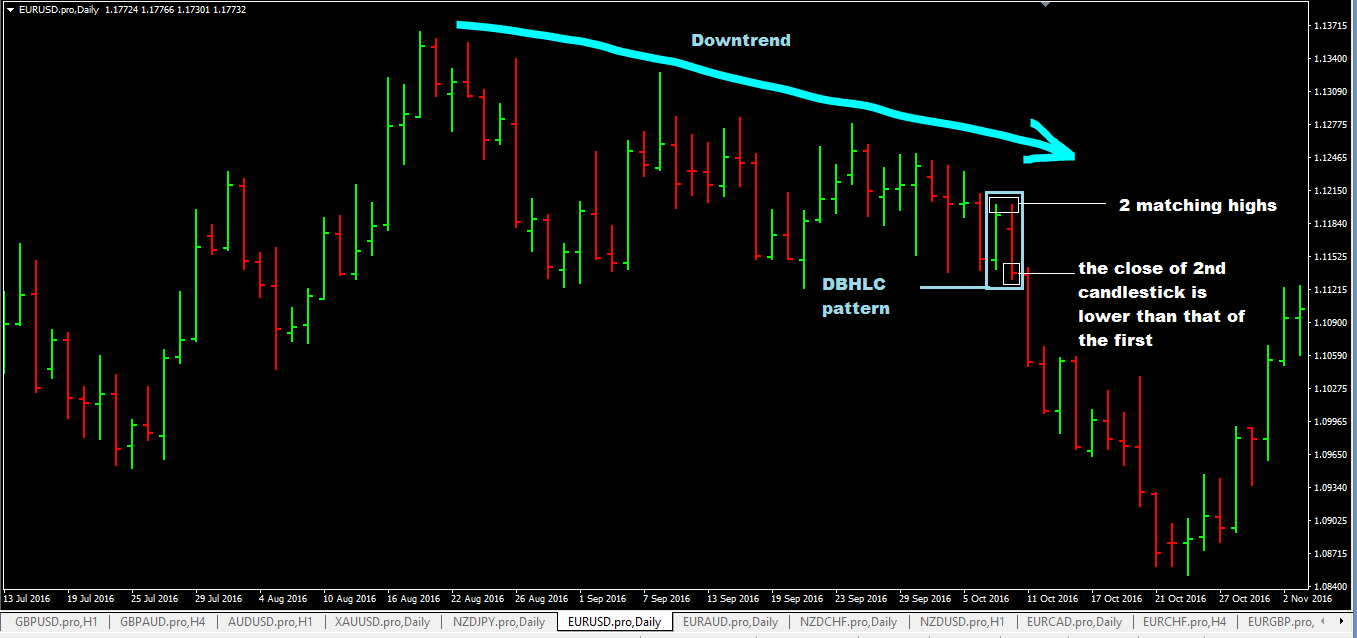
#2:Double Bar High Lower Close (DBHLC) Strategy
The DBHLC is also a 2 bar pattern.
The first and the second bar should have matching highs. Or the highs must be within two pips of each other. In other words, their highs are almost on the same price level.
The second bar must have a close lower than the close of the first bar.
When these conditions are satisfied, what you have is a DBHLC pattern.
The DBHLC pattern is a bearish pattern. Which means you sell when you see the DBHLC pattern form.
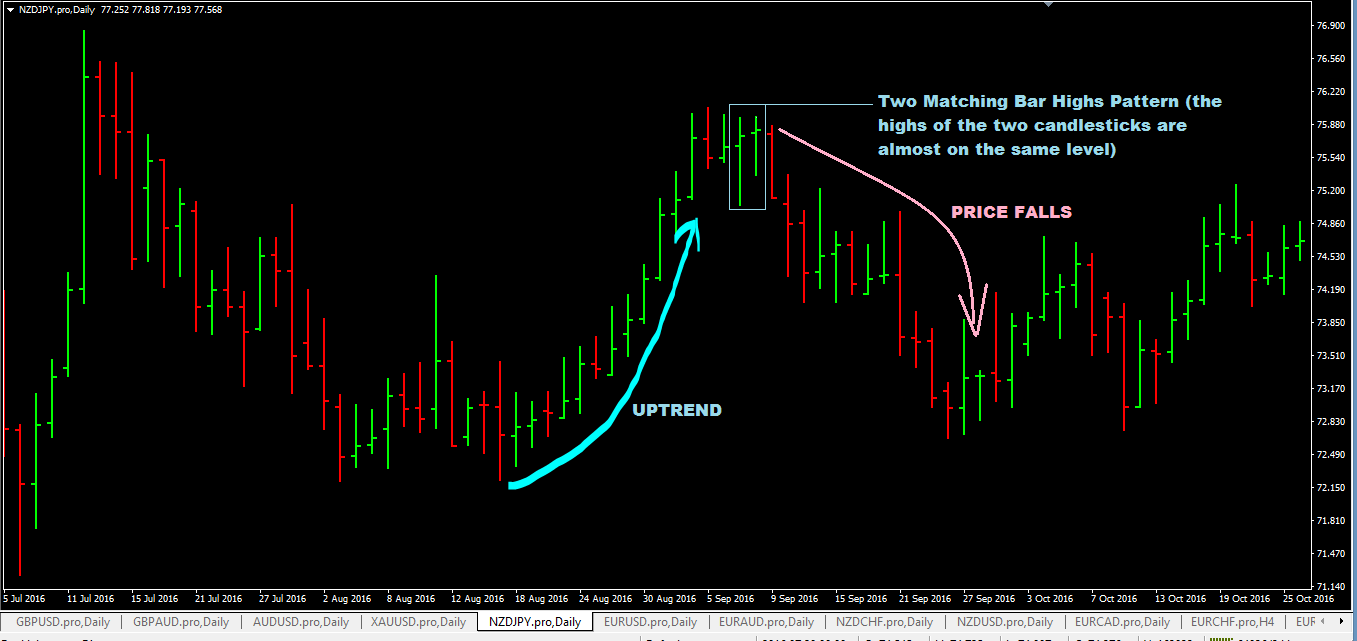
#3: Two Matching Highs Pattern Strategy
The two matching highs pattern is a two candlestick pattern. It consists of two bullish candlesticks that have the same or almost the same highs.
This is a bearish reversal candlestick pattern.
Another thing is that, it can be hard to find in forex charts as it is one of those forex reversal candlestick patterns that does not form regularly especially if you are trading based on the daily charts.
If you decide to trade this pattern using much smaller timeframe, than there’s a good chance that you’ll be able to see a lot more two matching highs pattern than from a daily chart perspective.
Ideally, you should be looking for the tow matching highs pattern in an uptrend when price hits a resistance level or in a downtrend when price makes a minor temporary rally and should this matching highs form, it can lead to the continuation of that downtrend.
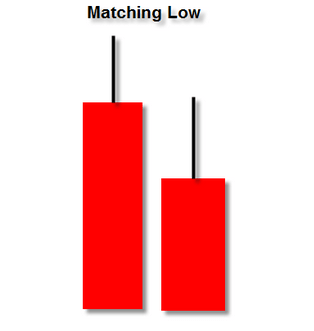
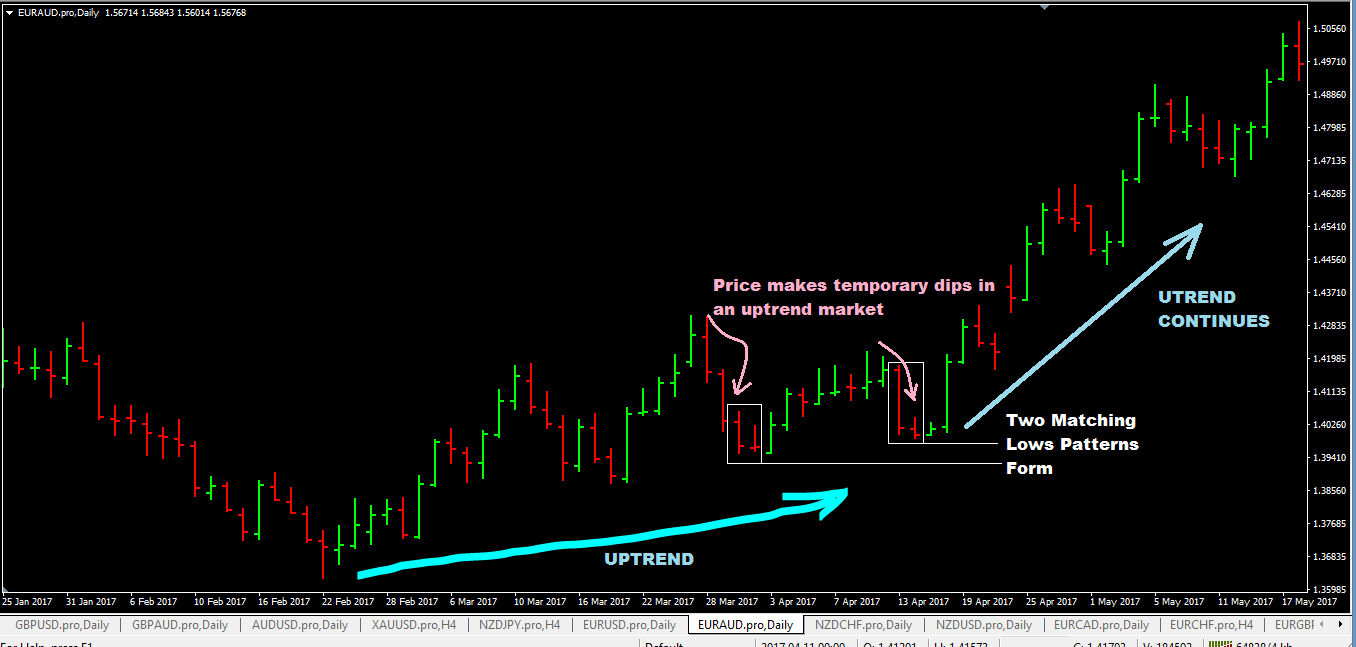
#4: Two Matching Lows Pattern Strategy
The two matching lows pattern is made up of two bearish bars that have that same low. It is a bullish reversal pattern.
And again, similar to the two matching highs pattern, this pattern rarely tends to form on forex charts especially if you are trading the daily charts.
I’m guessing, if you go down to much smaller timeframes, you may have a lot more chance of finding or seeing two matching lows pattern forming.
The fact that those bars have made a low on the same price level indicates that a support level has been made and the market may be due for a reversal upward (uptrend).
You should be looking for two matching lows pattern on support levels or in an uptrend market when price makes a dip, look for matching lows pattern to buy.
#5: Bearish Outside Vertical Bar(BEOVB) Strategy
The bearish outside vertical bar is a two candlestick pattern and as the name says, it is a bearish reversal pattern.
Ideally, you want to be looking for BEOVB patterns in uptrend when price hits a resistance level or when price is in a downtrend and there’s a minor rally in that downtrend.
The first candlestick must be bullish.
The second candlestick must be bearish with the following characteristics:
- it must have low that is lower than that of the first candlestick
- it must have a high that is higher than that of the first candlestick
- it also must have a close that is lower than that of the first candlestick
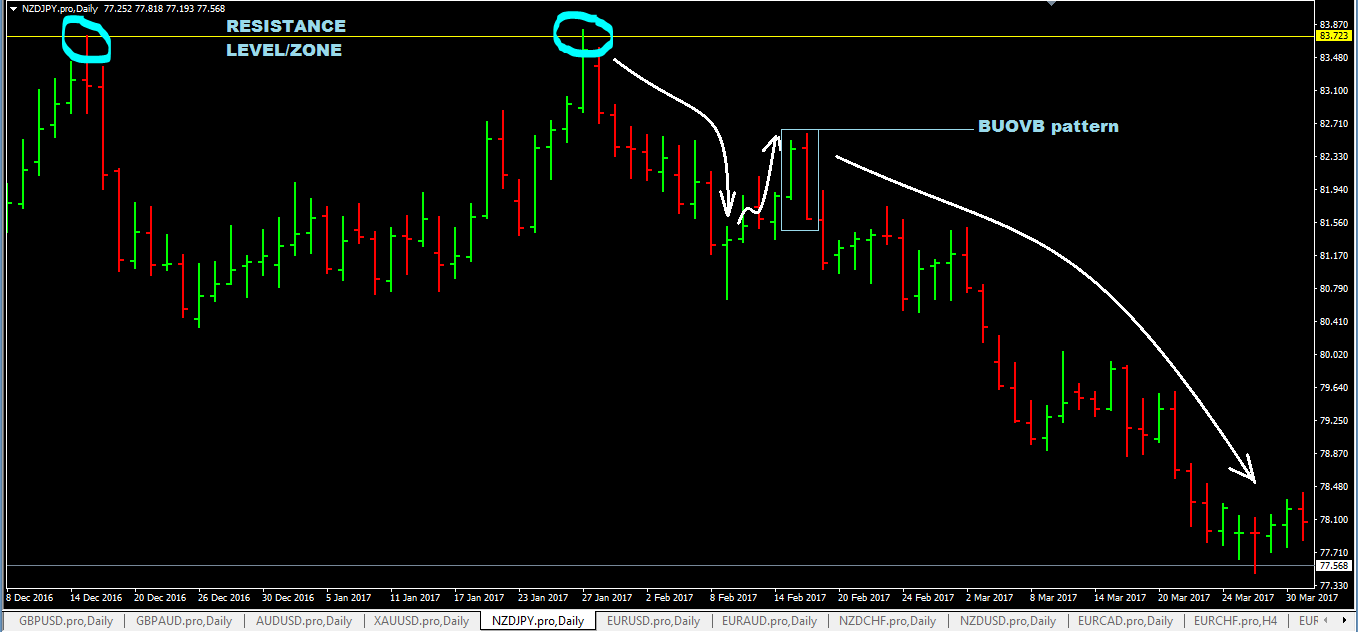
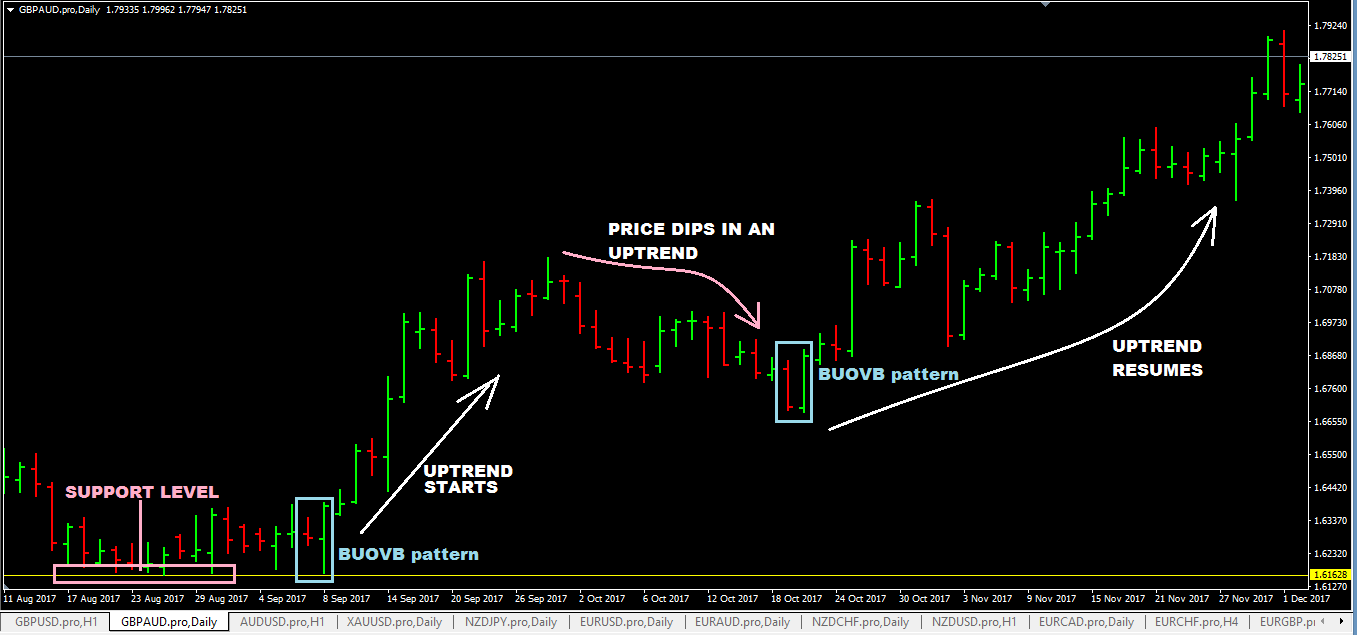
#6: Bullish Outside Vertical Bar(BUOVB)
The bullish outside vertical bar is a 2 candlestick pattern and as the name say, it is a bullish reversal pattern.
You should be looking for BUOVB patterns in dips in a rally or in support levels to buy.
The first candlestick is a bearish candlestick.
But the second candlestick must be a bullish candlestick. It is the characteristics of the 2nd candlestick that defines what the bullish outside vertical bar is:
- the second candlestick must have a high, higher than that of the first candlestick
- it also must have a low, lower than that of the first candlestick.
- the second candlestick must also have a close that is higher than the close of the first candlestick
#7: Pin Bar Strategy
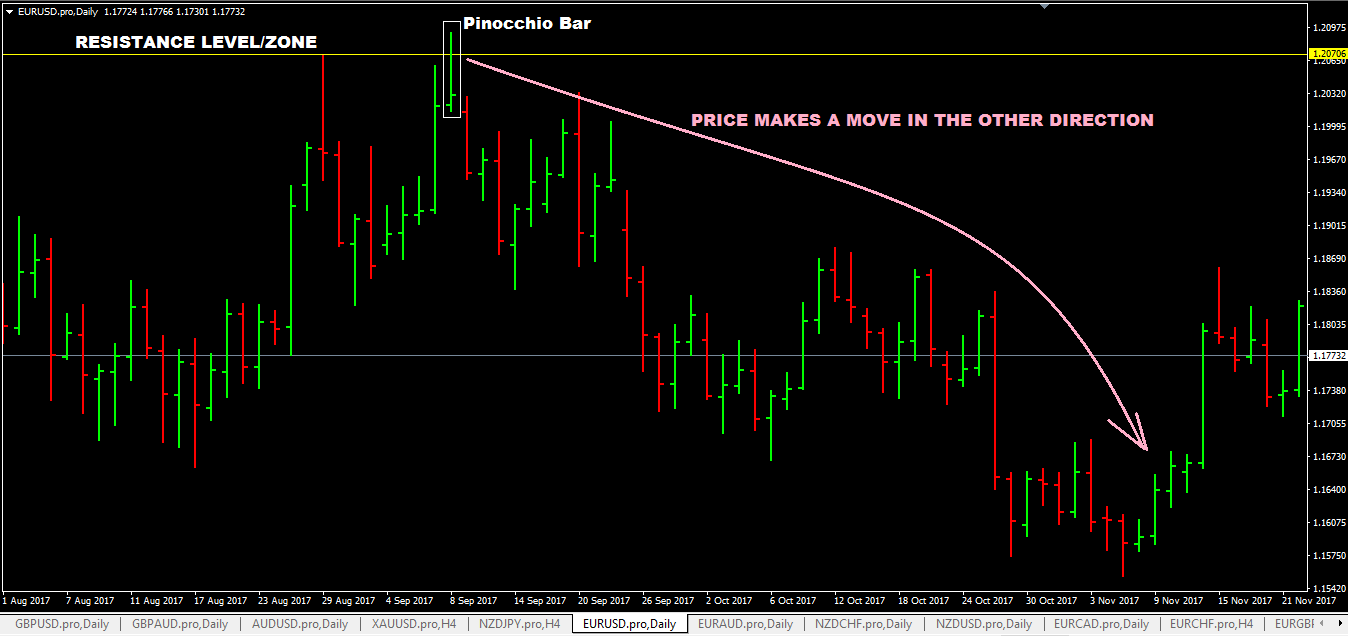
The pin bar or the Pinocchio pattern because it lies (Just like in the story of Pinocchio, the more lies Pinocchio tells, the longer his nose grows!) about the direction of the market.
The long nose exposes the lie.
So this is what happens:
- traders will place orders in levels of resistance and support and price makes a short-lived break of that level and the traders think they made the right choice.
- But soon, this changes and they are starting to lose money when the long nose starts forming.(tail of the pin bar)
- What is now happening is pin bar is beginning to form ad as soon as the bar close close to or within the support or resistance levels, you now have a confirmed pin bar.
- Once that pin bar closes, price makes a move in the other direction!
The chart below shows a bearish pin bar setup:
- Price was in an uptrend until it hit the resistance level
- when the pin bar formed, it made a break of the resistance level but then closed back under that resistance level
- price then moved down from there.
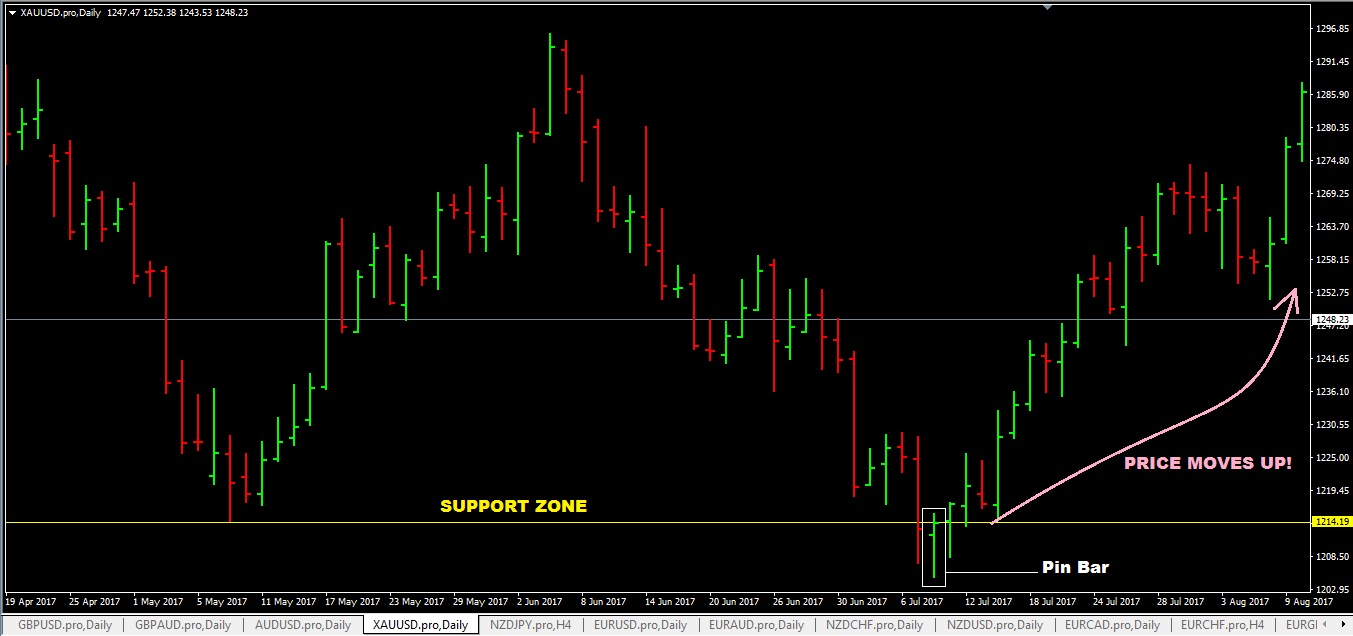
This chart below shows a bullish pin bar trade setup:
- as you can see price was in a downtrend and hit a support level and make a break for it but that break wasn’t sustained
- after the pin bar formed, price moved up
How To Trade These Patterns? Trading Rules
- If you are trading these pattern on the 4hr or the daily timeframe, I suggest you use pending stop orders: pending buy stop order for bullish pattern setups and pending sell stop order for bearish pattern setups.
- for bullish pattern, place pending buy stop order at least 1-2 pips above the high the 2nd candlestick pattern if it is a two pattern candlestick pattern or for a pin bar pattern, it is pretty straight forward.
- for stop loss on a bullish pattern setup, place it at least 2 pips below the low of the entire pattern.
- for take profit targets on bullish pattern setups, use risk:reward of 1:3 or looking for previous swing highs (peaks) and use them as your take profit target levels.
What about bearish patterns?
Do the exact opposite…
Don’t forget to share these james16 forex price action trading strategies by clicking those sharing buttons below. Thanks.
